All Internal Monitor Detailed Report
Summary
This dataview shows all custom internal monitors with detailed implementation status information.
Columns
| Column | Description |
|---|---|
| Monitor | Internal monitor name. |
| Monitor Nature | This indicates whether the internal monitor is a ProVal monitor or a Default Non-ProVal monitor. |
| Monitor Status | This indicates whether the monitor is disabled or enabled. |
| Interval | This shows the frequency of the monitor execution in seconds. |
| Interval String | This shows the frequency of the monitor execution in Days, Hours, and Minutes format. |
| Alert Style | This indicates the monitor's alert style, which specifies the number of failures required to trigger an alert. 0 - Send Fail After Success: Triggers an alert for each failure and waits for success to report to re-trigger the autofix. 1 - Once Per Day: Triggers an alert for a failure once per day. 2 - Once Per 2 Days: Triggers an alert for a failure once every 2 days. 3 - Once Per 3 Days: Triggers an alert for a failure once every 3 days. 4 - Once Per 4 Days: Triggers an alert for a failure once every 4 days. 5 - Once Per 5 Days: Triggers an alert for a failure once every 5 days. 6 - Once Per 6 Days: Triggers an alert for a failure once every 6 days. 7 - Once Per 7 Days: Triggers an alert for a failure once every 7 days. 8 - Once Per 30 Days: Triggers an alert for a failure once every 30 days. 9 - Once Per 60 Days: Triggers an alert for a failure once every 60 days. 10 - Once Per 90 Days: Triggers an alert for a failure once every 90 days. 11 - Once Per Year: Triggers an alert for a failure once per year. 12 - Once Per 5 Years: Triggers an alert for a failure once every 5 years. |
| Last Scan | This stores the last scan date of the internal monitor. |
| Last Failure | This shows the last failure detection date of the internal monitor. |
| Next Scan | This shows the next upcoming scan date of the internal monitor. |
| Group | This indicates the targeted group if the monitor is applied to a specific group. A blank entry denotes that the monitor is applied globally to the environment. |
| Alert Template | This contains the alert template applied with the monitor on the targeted group or globally. |
| Alert Template Description | This shows detailed information on the alert template if provided during creation. |
| Script | This shows the script that is running as an autofix with the monitor via the applied alert template. |
| Script Nature | This indicates whether the autofix script is a ProVal Script or a Default script. |
| Ticket Category | This shows the ticket category name to which the ticket will be generated via the autofix alert template. |
| Synced/Updated | This indicates whether the internal monitor was synced from the ProSync plugin or not. |
Color Coding
Color coding is applied to the columns "Monitor Nature," "Monitor Status," "Script Nature," and "Synced/Updated" as shown below:
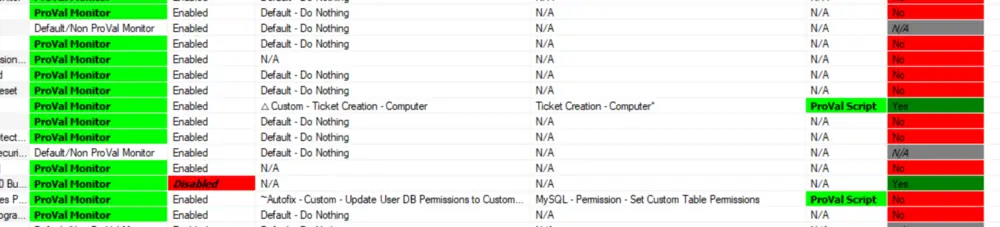
- Monitor Nature: The "ProVal Monitor" is highlighted in green to distinguish ProVal internal monitors from others.
- Monitor Status: The "Disabled" font is bold/italic and highlighted in red to draw attention to disabled monitors.
- Script Nature: The "ProVal Script" is highlighted in green to indicate where "ProVal" scripts are used as autofixes.
- Synced/Updated: "Yes" is highlighted in green, "No" in red, and "N/A" in grey to easily indicate whether the monitor is properly synced/updated from the ProVal plugin.
Changelog
2025-04-10
- Initial version of the document