Memory Threshold Violation Monitoring
Summary
The Memory Threshold Violation Monitoring monitor continuously checks the local Memory usage (specifically % Committed Bytes In Use) on Windows endpoints against the thresholds defined in the configuration file generated by the Memory Threshold Violation Monitoring Configuration Writer task. It does not read custom fields directly; instead, it relies on the pre‑built JSON configuration to know when to alert and when to consider the situation resolved.
How It Works
-
Configuration File
At each check interval, the monitor reads the fileC:\ProgramData\_Automation\Script\Test-MemoryUsage\Test-MemoryUsage.json. This file contains three values:- HighThreshold – the Memory usage percentage that starts the timer.
- LowThreshold – the Memory percentage that resets the timer if usage drops below it.
- UsageMins – the number of minutes the Memory must remain above the low threshold (after initially exceeding the high threshold) before an alert is raised.
-
Two‑Threshold Logic with a Marker File
The monitor uses a small flag file (Test-MemoryUsage.flag) to remember that a high‑Memory event has started.- When the Memory usage first exceeds
HighThreshold: The marker file is created. The timer begins. - While Memory usage remains above
LowThreshold: The marker file stays in place and the elapsed time is continuously measured. - If the elapsed time reaches
UsageMins: An alert is generated. - If Memory usage drops below
LowThresholdat any point: The marker file is deleted and the timer is immediately reset. No alert is produced.
- When the Memory usage first exceeds
-
Alert Message
When the sustained condition is met, the monitor outputs a detailed message that includes:- The high threshold that was breached and how long ago it was exceeded.
- The low threshold that the Memory has remained above.
- The current Memory usage percentage.
- A list of the top five processes consuming Memory resources (calculated as a percentage of total physical memory).
- If PowerShell is among those processes, its full command line is appended to assist with investigation.
-
Resolution
Once the Memory usage falls back below the low threshold, the marker file is deleted. The monitor produces no output, which the monitor set interprets as a healthy state. If automatic resolution is enabled (as configured in the monitor set), the corresponding ticket is closed automatically.
Scenario – Alert Triggered
A server’s Memory usage spikes to 98% at 10:00 AM. The configured thresholds are:
- HighThreshold = 95%
- LowThreshold = 90%
- UsageMins = 30 minutes
The Memory stays above 90% for the next 35 minutes. At approximately 10:35 AM, the monitor detects that the sustained time has exceeded 30 minutes and returns an alert message. A ticket is created with the Memory percentage and the list of top processes.
Scenario – Alert Not Triggered (Timer Reset)
The same server experiences a spike to 98%, but after 20 minutes the Memory drops to 85%. Because 85% is below the low threshold, the marker file is deleted. The timer resets. When the monitor next runs, it sees no marker file and uses the high threshold again. No alert is generated.
Scenario – Automatic Resolution
Later in the day, the Memory usage drops to 40% and stays low. On the next check, the marker file (if it existed) is removed. The monitor outputs nothing, indicating a healthy state. The monitor set’s automatic resolution rule then closes any open ticket for this machine.
This design ensures that brief spikes or momentary dips do not cause unnecessary tickets, while truly sustained high Memory usage is reliably flagged for investigation.
Dependencies
- Group: Memory Threshold Violation Monitoring
- Task: Memory Threshold Violation Monitoring Configuration Writer
- Solution: Memory Threshold Violation Monitoring
Monitor Setup Location
Monitors Path: ENDPOINTS ➞ Alerts ➞ Monitors
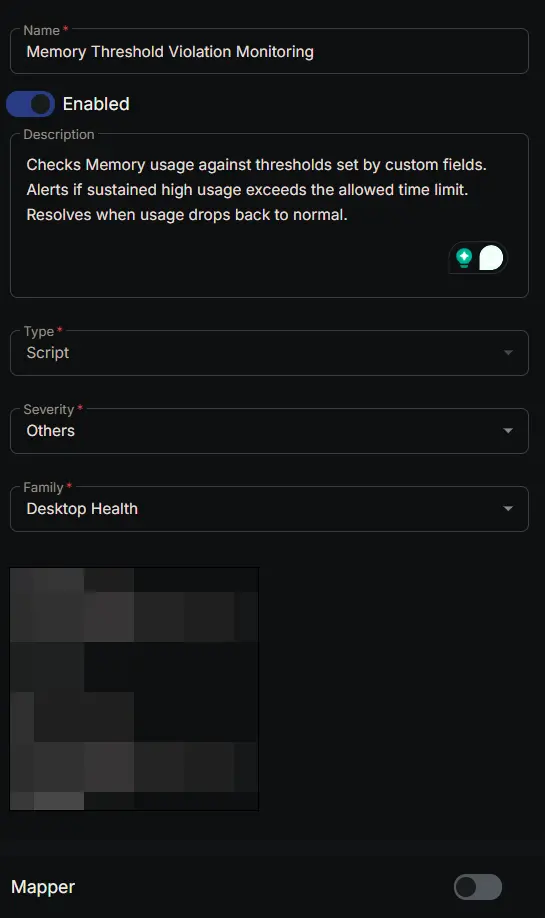
Monitor Summary
- Name:
Memory Threshold Violation Monitoring - Description:
Checks Memory usage against thresholds set by custom fields. Alerts if sustained high usage exceeds the allowed time limit. Resolves when usage drops back to normal. - Type:
Script - Severity:
Others - Family:
Desktop Health
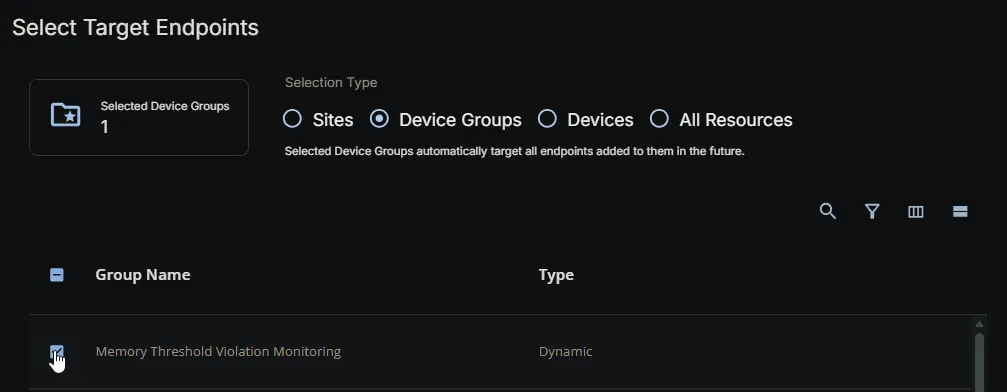
Targeted Resources
- Target Type:
Device Groups - Group Name:
Memory Threshold Violation Monitoring
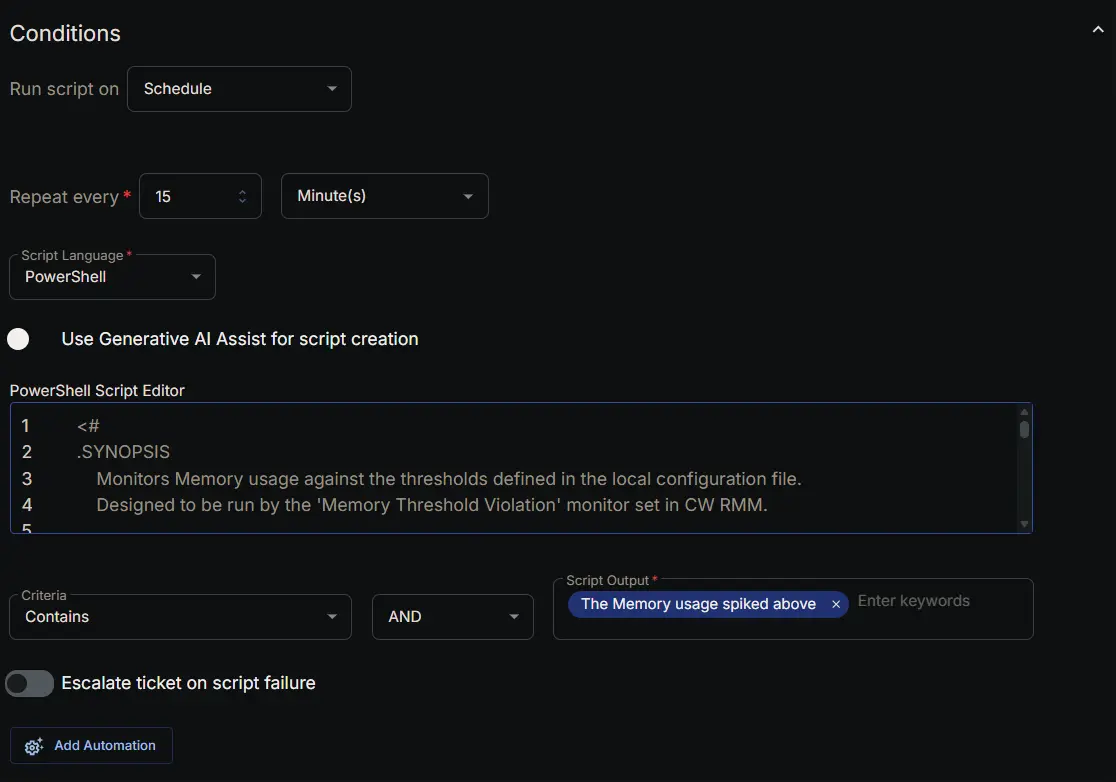
Conditions
-
Run script on:
Schedule -
Repeat every:
15Minute(s) -
Script Language:
PowerShell -
Use Generative AI Assist for script creation:
False -
PowerShell Script Editor:
- Criteria:
Contains - Operator:
AND - Script Output:
The Memory Usage spiked above - Escalate ticket on script failure:
Disabled - Add Automation:
<Leave it untouched>
Ticket Resolution
-
Automatically Resolve:
Enabled -
Dropdown Option:
Run same script as above -
Criteria:
Does Not Contain -
Operator:
AND -
Script Output:
The Memory Usage spiked above

Monitor Output
Output: Generate Ticket

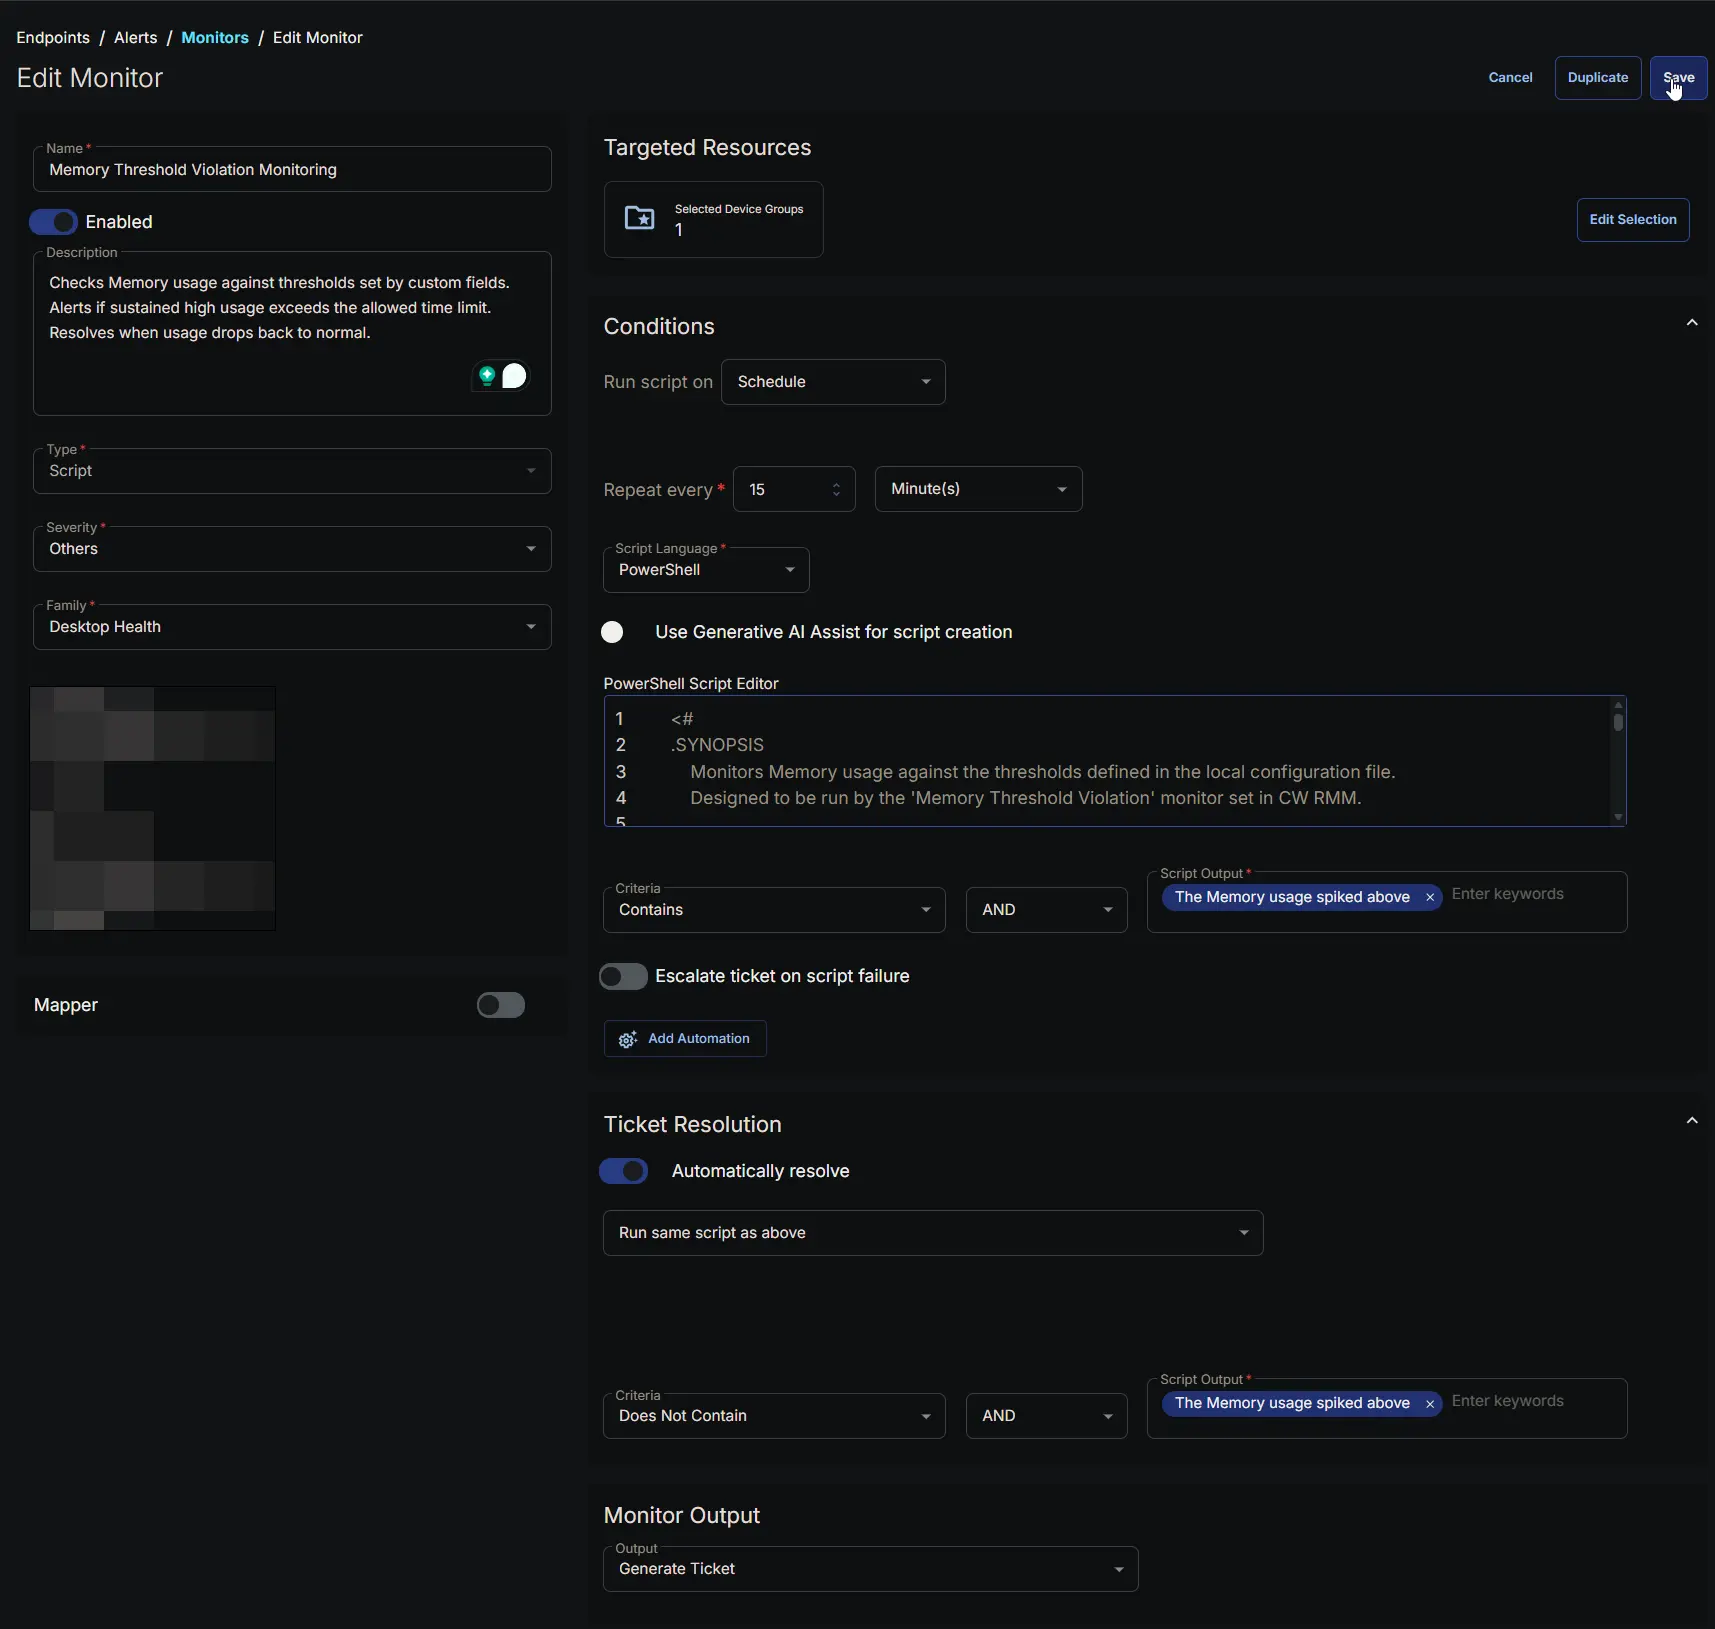
Completed Monitor
Changelog
2026-07-15
- Initial version of the document