Script Failure Assessment
Summary
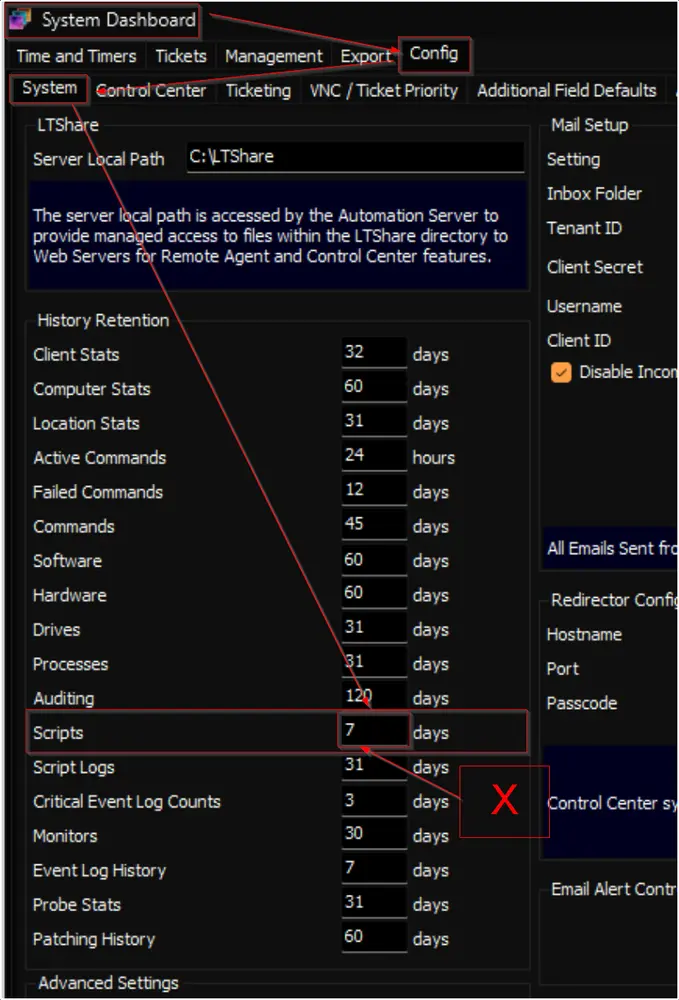
The dataview presents a detailed analysis of script failures over the past 'X' days, based on the script history logs. It counts the number of failures at each step and highlights the steps where scripts are most frequently failing across all machines. The retention period for the logs, represented by 'X', is user-defined.
Columns
| Column | Description |
|---|---|
| ScriptID | Script ID |
| Script | Script Name |
| Is Computer Script | Is this a Computer Script? (0/1) |
| Is Offline Script | Is this an Offline Script? (0/1) |
| Affected Computers | Count of distinct computers on which the script has run |
| Total Runs | Total number of runs |
| Total Failures | Total number of failures |
| Total Failure % | Overall Failure Percentage |
| Script Step | The step where the script failed |
| Script Function | Function that failed |
| Step Failure Count | Number of failures on the same script step |
| Step Failure % | Percentage of script failures on the same step |
| SQL Execution Failures | Total number of times it failed to execute the SQL query |
| SQL Execution Failures % | Percentage of failures due to SQL query execution failure |
| Kill Command Issued | Total number of times it failed because of timeout (either the computer went offline during a command execution or an execute script function ran for over 6 hours) |
| Kill Command Issued % | Percentage of failures because the Kill Command was issued |
| First Failure Date | First Failure Date |
| Last Failure Date | Last Failure Date |
Changelog
2025-04-10
- Initial version of the document