Memory Threshold Violation Monitoring [Workflow]
Summary
The Memory Threshold Violation Monitoring [Workflow] monitor continuously checks local memory usage (specifically the % Committed Bytes In Use counter) on Windows endpoints against the sustained‑usage thresholds defined in the configuration file generated by the Memory Threshold Violation Monitoring Configuration Writer task. It does not read custom fields directly; it relies on the pre‑built JSON configuration — which also carries the ticketing webhook URL (TicketWebhookUrl) — to know when to alert, when to consider the condition resolved, and where to send ticket actions.
This is the workflow‑based variant of the monitor. The original Memory Threshold Violation Monitoring set uses the monitor's built‑in ticketing: it raises one ticket per incident and auto‑resolves it on recovery (via the monitor set's automatic resolution rule), but the ticket subject and body are monitor‑generated and not customizable, and a comment is appended on every detection while the alert persists, making the ticket bulky. This variant instead manages the ticket lifecycle through the CWRMM Ticket Management for Monitors workflow: it tracks ticket state locally and fires webhooks to create a clean ticket when a sustained high‑memory condition is confirmed and close it when usage recovers. Like the original, it creates a single ticket per incident and closes it automatically on recovery — but with a controlled subject and body (including the top memory‑consuming processes), no per‑detection comment spam, and a standardized, workflow‑managed lifecycle.
How It Works
-
Configuration File
At each scheduled run (every 15 minutes, as configured), the monitor readsC:\ProgramData\_Automation\Script\Test-MemoryUsage\Test-MemoryUsage.json. This file contains:- HighThreshold – the memory usage percentage that starts the timer.
- LowThreshold – the memory percentage the usage must stay above to keep the timer running (and below which the timer resets).
- UsageMins – how many minutes the memory must remain above the low threshold (after first exceeding the high threshold) before an alert is raised.
- TicketWebhookUrl – the workflow webhook URL that ticket actions are POSTed to.
If the file is missing or cannot be parsed, the monitor returns a failure message and skips the run without changing any state or firing any webhooks.
-
Memory Sampling
The monitor samples the\Memory\% Committed Bytes In Usecounter once per second for 10 seconds and averages the result to get a stable current memory percentage. If counter sampling fails or returns no data, the monitor returns early without modifying any ticket state — a safeguard so a transient counter failure never accidentally closes an open ticket. -
Two‑Threshold Hysteresis with a Marker File
To distinguish a brief spike from a genuinely sustained condition, the monitor uses two thresholds and a small marker file (Test-MemoryUsage.flag) that records when the current event began:- No marker file: the active threshold is the HighThreshold. When memory usage first reaches or exceeds it, the marker file is created and the timer starts.
- Marker file present: the active threshold drops to the LowThreshold. As long as memory usage stays at or above the low threshold, the marker remains and the elapsed time (measured from the marker's creation time) keeps accumulating.
- Usage drops below the active threshold: the marker file is deleted and the timer resets immediately, so the event must begin again from the high threshold.
- Elapsed time reaches
UsageMins: the sustained condition is confirmed and an alert is built for this run.
-
Sustained‑Breach Alert Content
Once the sustained condition is confirmed, the monitor builds a ticket subject (Memory Threshold Violation - Memory - <ComputerName> - <HighThreshold> Percent) and a body that records how long ago the spike began, the low threshold the memory has stayed above, the current memory percentage, and the top five memory‑consuming processes (each process's working set expressed as a percentage of total physical memory). If PowerShell appears among those processes, the command lines of the runningpowershell.exeinstances (excluding the monitor's own process) are appended to assist investigation. The memory component is then marked as "detected" for this run. -
Ticket State Machine (duplicate prevention)
This is the core of the variant. The monitor maintains three local state files alongside the config:Memory_To_Create_Ticket.jsonMemory_With_Existing_Ticket.jsonMemory_To_Close_Ticket.json
Because the monitor tracks a single component (
Memory), there is at most one open memory ticket per device. For that component, it applies the following transitions each run:Memory condition this run Previous state Transition Webhook Sustained breach detected not tracked Added to Create CreatefiresSustained breach detected Create Moved to Existing none Sustained breach detected Existing Kept in Existing none Recovered (below low threshold) Create or Existing Moved to Close (subject kept, body replaced with a recovery message) ClosefiresRecovered Close Cleared from Close none No active event not tracked No record none Because a confirmed breach fires
Createonly on the run it first appears and is then promoted to Existing, a sustained high‑memory event produces exactly one ticket, no matter how many 15‑minute runs occur while it persists. On recovery,Closefires once and the record is then cleared, so it never fires twice. -
Webhook Execution
When the component is newly in the Create list, the monitor POSTsAction = Create; when it is newly in the Close list, it POSTsAction = Close. Each payload carriesAction,TicketSubject,TicketBody, andDeviceId(read from the endpoint's registry). The webhook URL is theTicketWebhookUrlvalue from the config file. The CWRMM Ticket Management for Monitors workflow receives the payload and performs the actual ticket creation or closure in ConnectWise. This monitor uses only theCreateandCloseactions; it does not sendComment. -
Reporting and Alert Signal
If aCreateorClosewebhook fired, the monitor returnsAction detected - N component(s) for ticket creation and M component(s) for ticket closure; otherwise it returnsMemory monitoring state evaluated successfully. The monitor's success criteria is configured as Script Output containsAction detected, so CW RMM only flags the monitor on runs where a ticket action actually occurred. Because RMM's own ticketing is set to Do not Generate Ticket, Escalate ticket on script failure = Disabled, and Automatically Resolve = Disabled (closure is handled by the workflow'sClosewebhook, not by RMM), that flag is purely informational — the real ticket lives in ConnectWise and is owned by the workflow, not by RMM. -
Failure Handling
- Missing/invalid config → run skipped, no state change, no webhooks.
- Memory counter sampling failure → early return that preserves existing ticket state.
- Webhook failure → logged, the run is reported as
Failure, but processing continues. - Note: state files are written before the webhooks fire, so a failed
CreateorCloseis not automatically retried on the next run — the memory condition must change state again (re‑breach or re‑recover) for a new webhook to be sent.
Scenario – Alert Triggered (Create)
A server's memory usage spikes to 98% at 10:00 AM. The configured thresholds are HighThreshold = 95%, LowThreshold = 90%, UsageMins = 30 minutes. Because 98% exceeds the high threshold, the marker file is created and the timer starts. The memory stays above 90%, so the marker persists. On the first 15‑minute run after 30 minutes have elapsed (≈10:30 AM), the sustained condition is confirmed: the memory component is added to the Create list and a Create webhook fires. The workflow creates a ticket such as "Memory Threshold Violation - Memory - SERVER01 - 95 Percent" whose body lists the current usage and the top five memory‑consuming processes.
Scenario – Sustained Breach (No Duplicate)
The memory remains above 90% on the following runs. The marker file still exists and the elapsed time still exceeds 30 minutes, so the memory component is "detected" again each run — but it is now found in the Create list (then Existing), so it is promoted to Existing and no webhook fires. Only the single original ticket exists for the device, regardless of how long the condition persists — no duplicates, no repeated comments.
Scenario – Timer Reset (No Alert)
The server spikes to 98% and the marker file is created, but after 20 minutes the memory drops to 85%. Because 85% is below the low threshold (the active threshold while the marker exists), the marker file is deleted and the timer resets before 30 minutes ever elapse. The memory component is never "detected," so no webhook fires and no ticket is created. A future spike must exceed the high threshold again to start a new event.
Scenario – Automatic Resolution (Close)
After a ticket has been created and the memory component is in Existing, usage eventually drops to 40% and stays low. The marker file is removed and the memory component is no longer detected, so it is moved to the Close list — keeping the original ticket subject (so the workflow can match the open ticket) but replacing the body with "Memory usage has recovered and is now below the threshold. The ticket can be closed." A Close webhook fires and the workflow closes the ticket. On the following run the record is cleared from Close, so no further webhook is sent.
This design produces clean, workflow‑managed tickets — one per incident per device, no comment spam, and self‑closing on recovery — without the monitor‑generated formatting and per‑detection comments of the built‑in path, and without any native RMM ticketing tasks. It does depend on a valid TicketWebhookUrl in the configuration file (set via the Ticket_Mgmt_Webhook_Url custom field) and on the CWRMM Ticket Management for Monitors workflow being installed and reachable; if the URL is missing or invalid, webhooks fail and tickets will not be created or closed.
Dependencies
- Group: Memory Threshold Violation Monitoring
- Task: Memory Threshold Violation Monitoring Configuration Writer
- Triggers: CWRMM Ticket Management for Monitors
- Workflow: CWRMM Ticket Management for Monitors
- Solution: Memory Threshold Violation Monitoring
Monitor Setup Location
Monitors Path: ENDPOINTS ➞ Alerts ➞ Monitors
Monitor Summary
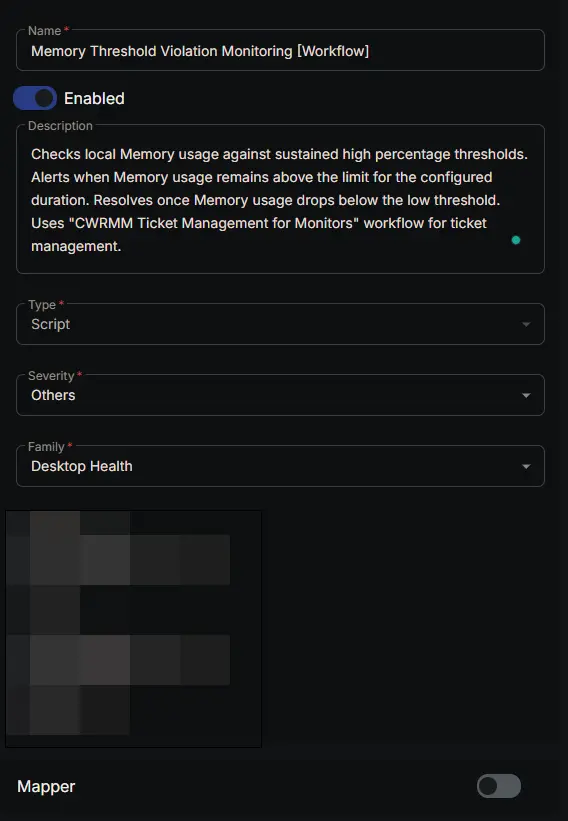
- Name:
Memory Threshold Violation Monitoring [Workflow] - Description:
Checks local Memory usage against sustained high percentage thresholds. Alerts when Memory usage remains above the limit for the configured duration. Resolves once Memory usage drops below the low threshold. Uses "CWRMM Ticket Management for Monitors" workflow for ticket management. - Type:
Script - Severity:
Others - Family:
Desktop Health
Targeted Resources
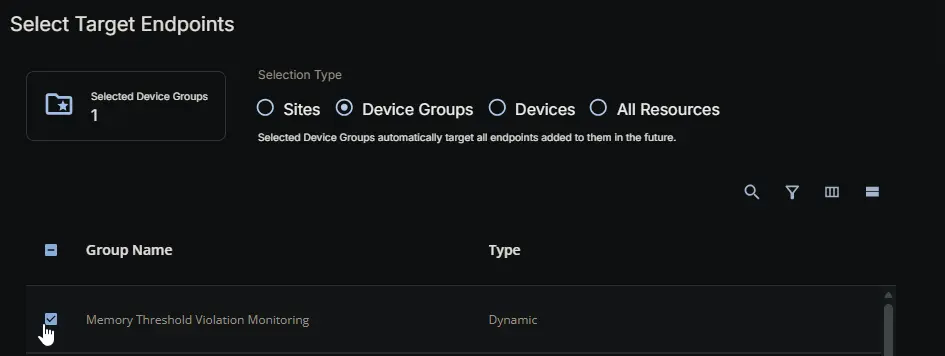
- Target Type:
Device Groups - Group Name:
Memory Threshold Violation Monitoring
Conditions
-
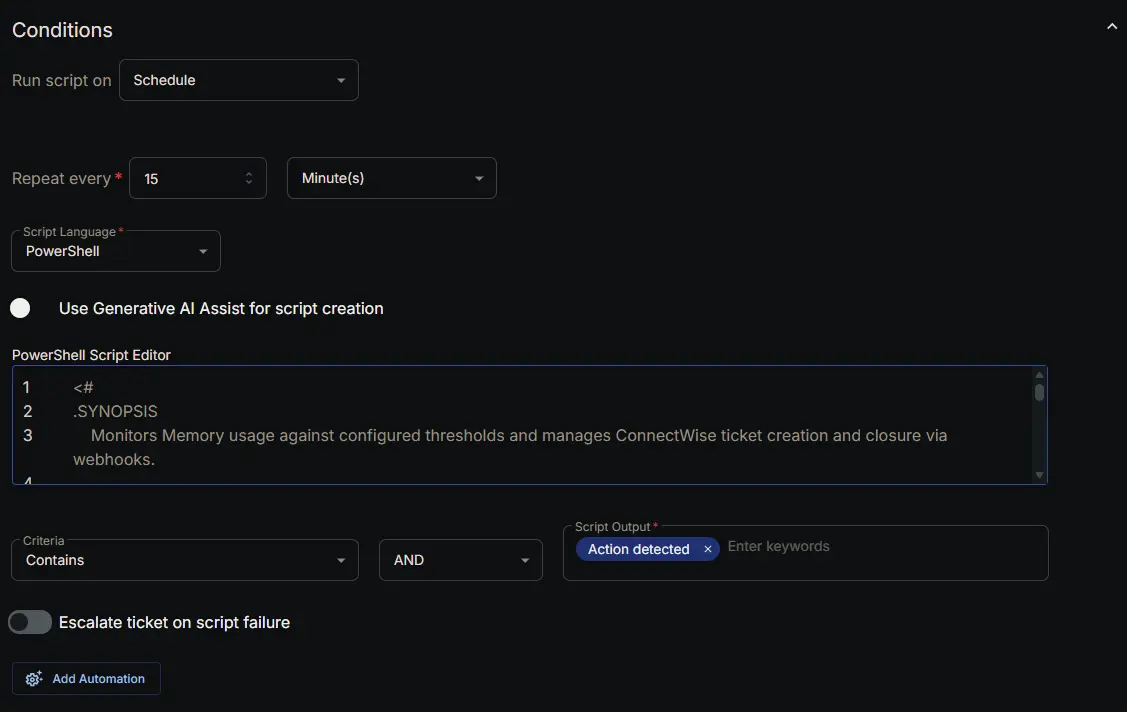
Run script on:
Schedule -
Repeat every:
15Minute(s) -
Script Language:
PowerShell -
Use Generative AI Assist for script creation:
False -
PowerShell Script Editor:
- Criteria:
Contains - Operator:
AND - Script Output:
Action detected - Escalate ticket on script failure:
Disabled - Add Automation:
<Leave it untouched>
Ticket Resolution
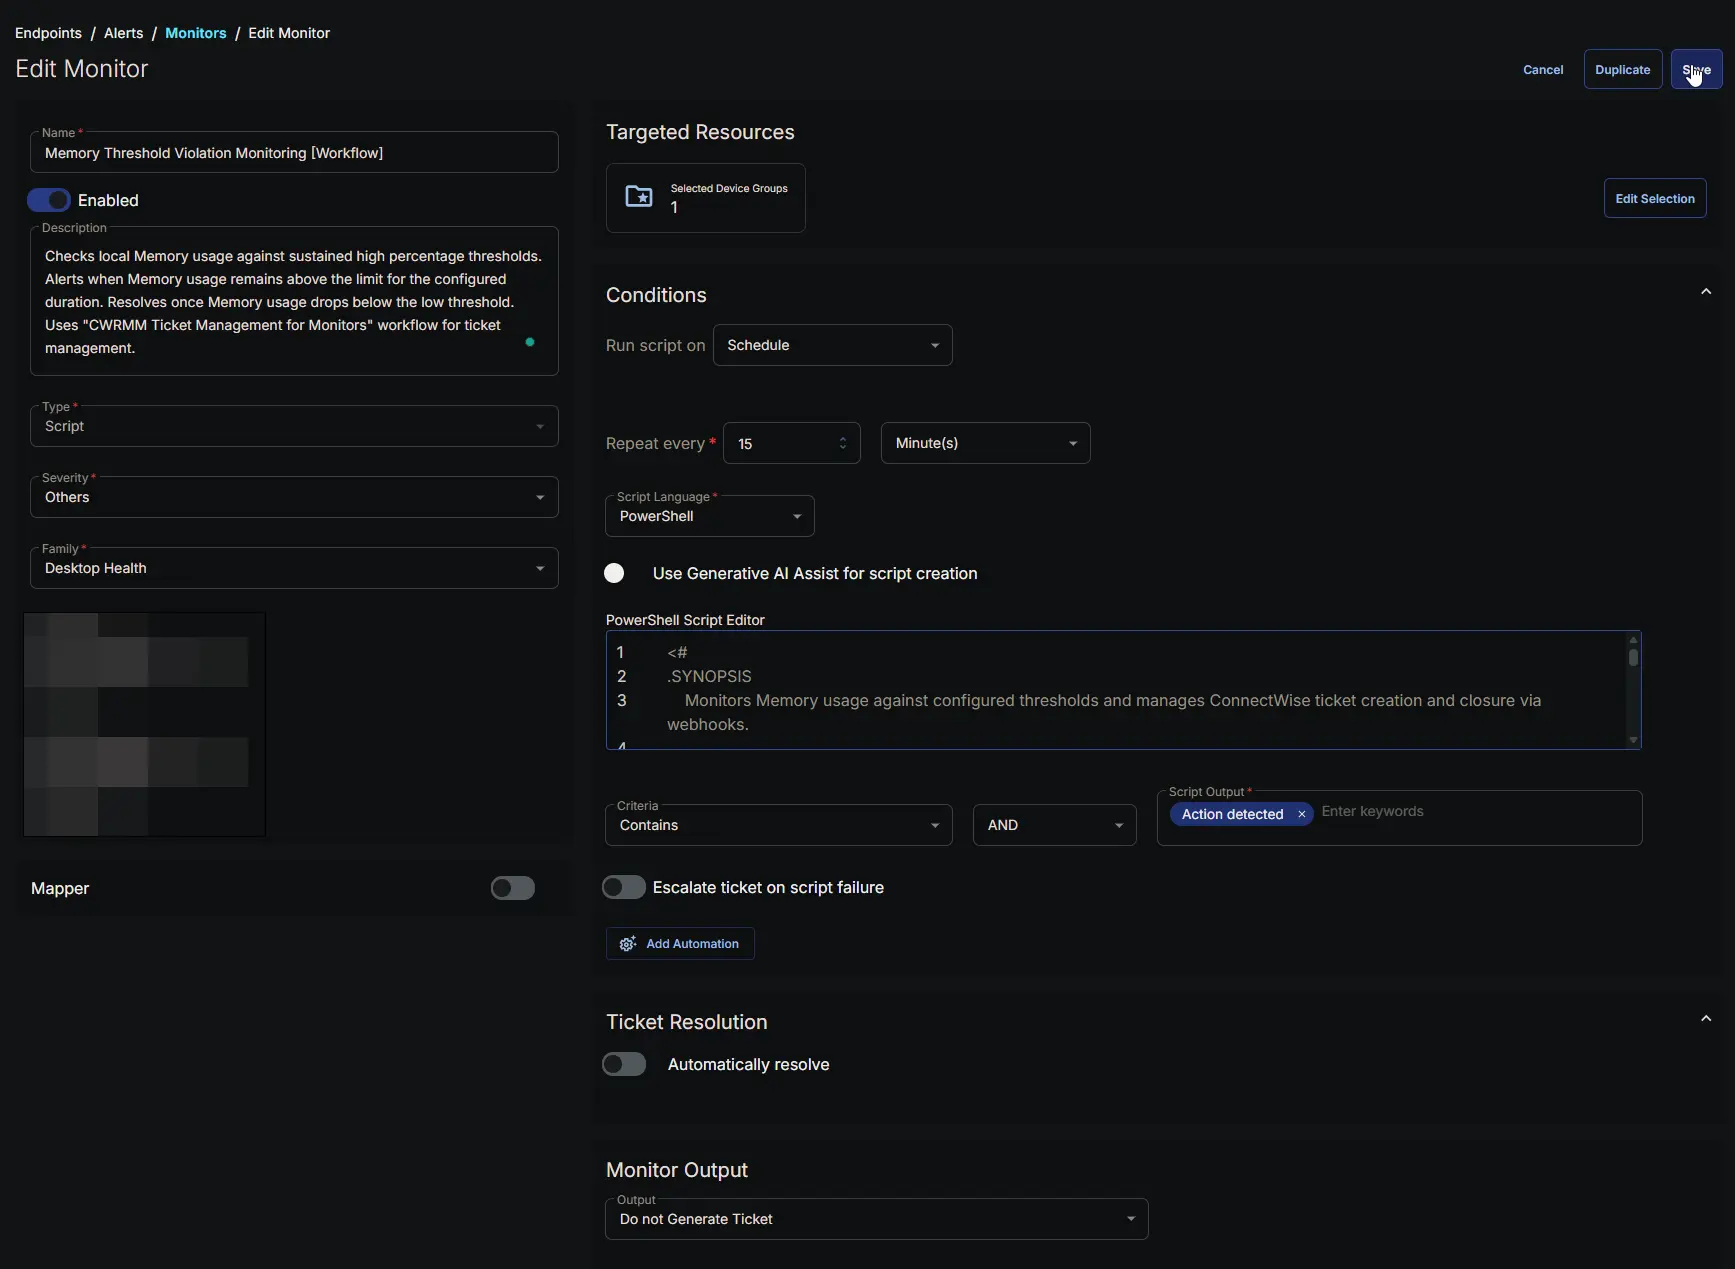
- Automatically Resolve:
Disabled

Monitor Output
Output: Do not Generate Ticket

Completed Monitor
Changelog
2026-07-23
- Initial version of the document